Eureka
A quantitative platform for Korean markets: pipeline, research, and eventually execution, built so the three end up as one system.
- Role
- Solo
- Period
- Feb 2026 – present
- Stack
- PostgreSQL, TimescaleDB, Python, PyTorch, statsmodels, FastAPI, systemd
- Repo
- Private. Happy to walk through the schema and rail design on a call.
What it is
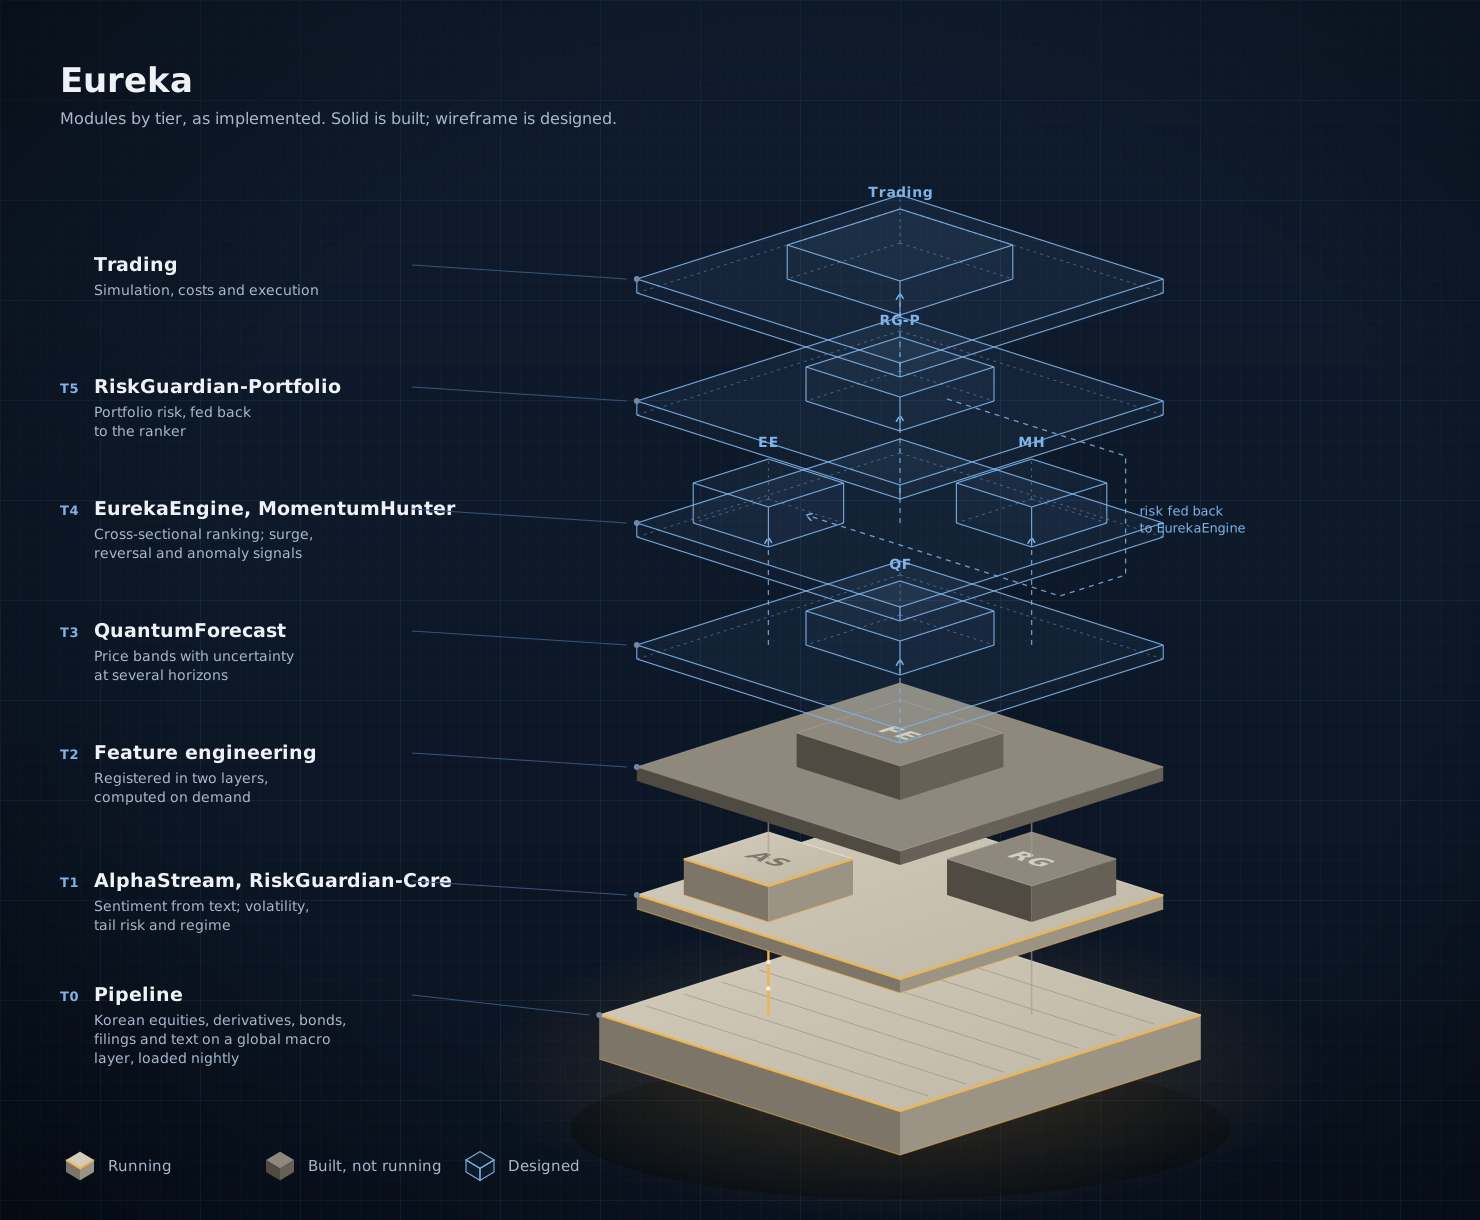
Eureka is three subprojects meant to end up as one system. A data pipeline covering Korean equities, derivatives, bonds, filings, news and analyst estimates, on a global macro layer with an economic and corporate event calendar. A quant-analysis layer of sentiment, features, risk and regime models. And eventually execution with portfolio optimization.
One guarantee: point-in-time correctness. Every value carries when it became known, not only when it happened. A revision in a filing, a rescheduled central bank meeting or a released economic figure moves into a feature, into a risk estimate, into a position, and at every step the system can answer what was actually known at that moment. Break that at one layer and the layers above inherit a number nobody could have had.
Why Korea first
I have followed this market for about eight years, which is long enough to have internalised the things that make it its own object rather than a smaller version of the US. Short-selling bans that arrive and stay for years. Daily price limits, and the characteristic behaviour of a stock the morning after it locks up. A derivatives market where most of the volume sits in contracts one or two days from expiry.
Those are not edge cases to patch in later. They change what a correct universe, a correct return series and a correct liquidity filter even mean.
Starting with the most constrained market also makes expansion easier in the right direction. The US and Hong Kong have fewer structural constraints; neither has daily price limits like Korea’s, for example. A system built around Korea’s rules extends to them by relaxing those rules. Going the other way means retrofitting constraints into a system that assumed they did not exist. China and Japan have their own limit and settlement regimes, so they come last and need their own handling.
Build order
| Component | Status |
|---|---|
| Pipeline: ingestion, PIT correctness, self-monitoring | Running unattended |
| AlphaStream: sentiment quantification | Stage 1 in production on Korean filings and news, 963,222 documents scored by a fine-tuned KR-FinBERT. Central bank statements next |
| RiskGuardian: GARCH, regime switching, VaR and CVaR | First version written and tested, 1,466 lines and 107 tests. Gated off until its inputs are stable |
| Feature engineering | 121 features registered across two layers, 30 more designed for derivatives. Latent features to be added behind a gate. Not yet persisted |
| Backtesting | Waiting. There is no model to test yet, and the pipeline is still being hardened |
| Execution and portfolio optimization | Not started |
Point-in-time correctness
Most market databases store one timestamp: when a thing happened. The tables that matter here store two, when it happened and when the database learned about it. A company files a quarterly report, then amends it six weeks later. A single-timestamp database overwrites the original, and every backtest touching that quarter uses numbers nobody had on the day.
- Fewer than a quarter of the tables carry a genuine second time axis. The axis is expensive and earns its cost only where data is actually revised: filings, macro releases, index membership. Prices are not revised, so they do not get it.
- Six distinct revision patterns. SCD2 valid-intervals on stock_master, vintage accumulation on macro_observation, supersession lineage on dart_filing_versions, because the shape of a revision differs by domain.
- The database refuses contradictions. On stock_master, is_active is forced by a CHECK to be biconditional with “this is the open segment.” Four invariants, zero violations across 14,936 segments.
- Events have the same problem. When a central bank meeting is rescheduled, a query as of an earlier date still returns the original date. Released figures are keyed to when they were published in local time; storing them in UTC had made releases between midnight and 9am Korea time land a day early.
- Survivorship is measurable, not aspirational. fn_universe_at('2010-06-30') returns 1,933 names; 1,392 are alive today. Approximating that universe with a current snapshot deletes 28% of it, and deletes exactly the names that failed.
Catching silent failure
The blind spot that reframed everything. Every monitor I had watched for an axis behaving strangely, which means an axis that had never flowed at all was invisible to all of them. Three financial tables stalled for 156 days with working code and zero entries in failed_calls, because the call path did not exist in the repo. The fix inverted the default: every production table now declares its expected cadence, and a table that is alive but undeclared is itself an alarm.
Quality is checked in three places.
At load time, bad data is refused before it lands. An API response of all zeros cannot overwrite existing real values, and the rule lives in SQL rather than Python, so a script writing to the database directly cannot get around it. It exists because 69,873 rows of investor flow data were once silently replaced with zeros. A balance sheet where assets do not equal liabilities plus equity is skipped rather than loaded.
After loading, four rails look for what got through. Each asks a different question, because they cannot answer each other’s.
| Rail | Asks |
|---|---|
| coverage_rail | What is missing? Missing days, empty columns, incomplete chains |
| sanity_rail | What is present and wrong? It tests identities that must hold arithmetically, not statistical outliers |
| ingestion_profile_rail | What is distributionally off against the trailing 20-day median? |
| freshness_contract_rail | What is absent, given the other three assume data flows at all |
On 2026-08-07 a live-quote run retroactively wrote that day’s prices onto the previous day’s rows. 2,416 rows that passed every coverage check, because both the rows and the columns were full. The day before, OHLCV was fine at 2,646 rows while market cap, PER, PBR and foreign ownership were entirely NULL. Missing and wrong are different failures and need different detectors.
The checks themselves are tested. A passing test suite tells you the tests ran, not that they would catch anything. Every night at 04:00 the system plants 18 hand-picked mutants across 9 targets and confirms the tests still fail on them. Eight consecutive runs, 18 of 18 caught. And a check that could not run is recorded as a failure, not a pass, because a check that silently did not run looks exactly like one that passed.
- Detectors live outside the chain. The old checks sat at the tail of ingestion, so when the chain aborted the detector died with it, and so did the alert. Silence at exactly the moment it mattered.
- A ledger, because a 14-day window forgets. Defects move through OPEN, RECOVERED, AGED_OUT and TERMINAL, and an AGED_OUT entry stops the rail from exiting clean.
- Alert fatigue as a measurable defect. 236 of 266 output lines were character-identical to the previous day’s, so individual rail alerts are off and a single digest reports new findings separately from continuing ones.
Falsifying my own decision
Share prices have to be adjusted for splits, reverse splits and other corporate actions, or a five-for-one split looks like an 80% crash overnight and a model learns it as a real move. The original design assumed the brokerage API already returned adjusted prices, so nothing was calculated locally.
Measurement showed that was only partly true. 194 stock splits between 2015 and 2024 had been adjusted, but 128 of 157 reverse splits in 2026 had not, and the field meant to mark a price as adjusted turned out to be a constant default rather than a fact. The database held adjusted and unadjusted prices mixed together, with no way to tell which was which.
Rather than rebuild the price history, I added a ledger that decides, event by event, whether each price was adjusted: 32 columns, 6,956 events from 2010 to 2026, each measured two independent ways. One compares closing prices across the event. The other compares exchange volume against raw share counts from a separate source. The two have different blind spots, and when they disagree the event is marked unresolved. A missing value is better than a wrong one.
| Model | Discontinuities |
|---|---|
| Raw | 455 / 642 |
| Old par-value model | 139 / 642 |
| New verdict ledger | 4 / 566 |
Every input stays in its own column, so when a verdict changes I can see which measurement moved it. Commercial data vendors hand you the adjustment factor and nothing else.
I also measured where the new method itself goes wrong. On the 418 pure splits where the price comparison is unambiguous, the volume comparison reads 9 backwards, 0.36% of all candidates. The opposite error cannot happen by construction.
Universe reconstruction
A stock delisted in 2017 and relisted on a different board in 2023 left an open segment covering the six years it was not listed, wrongly admitting it to 1,454 trading days of point-in-time universes. The fix was not a DELETE. The row was collapsed to a zero-width segment, effective_to = effective_from. Empty interval, so half-open PIT excludes it naturally, the CHECK constraints still pass, and the row survives for audit.
Market transfers are the mirror image. KRX publishes a KOSDAQ to KOSPI move as a delisting notice on the common share, so without a filter a live stock gets marked dead. Measured false intake on that one notice type: 170 rows, of which 42 were preferred lines, 67 warrant delistings and 61 market transfers.
Derivatives
42.1 million rows across 19 GB, the single largest block in the database and entirely KRX, from 2010-01-04 onward. Futures across index, single-stock, currency, rate and commodity, and 89 option series including the weeklies.
Expiration rules live in a document explicitly declared ground truth over the code, and holiday adjustment is asymmetric. Monday-expiry weeklies roll forward, everything else rolls back. That is close to impossible to infer from observed data and easy to get silently wrong in exactly the periods that matter. I verified it independently against the database: of 211 distinct KOSPI200 monthly option expiries, 208 land on Thursday and 3 on Wednesday, and across all 199 already-expired contracts the stored expiry equals the actual last trading day with zero mismatches.
- 45.97% of futures rows are calendar spreads. Mix them with outrights and half the universe is contaminated. The guard is a three-term COALESCE, so a new source inserting NULL still falls back to a name-token test.
- An issuer renaming itself splits its own time series. The underlying mapper checked master membership before the alias table, so a renamed name passed straight through and the same underlying lived under two names across 960 contracts. After correction it recurred and the triggering run was not reproducible, so I stopped trying to eliminate the cause and made it observable instead: a drift alarm that pins coordinates on the next occurrence, plus an idempotent daily canonicalization sweep.
- Two American intuitions turned out wrong here, both reverted by measurement. Expiry-week options are the most liquid on KOSPI200, not the least. And 75.7% of volume sits outside a ±15% moneyness band, because deep-OTM tail hedges are most of Korean index option flow.
The macro layer
Central bank data, sovereign curves, commodities and an economic event calendar, running alongside the Korean market data rather than after it, because the expansion roadmap needs it to already exist.
Every statistical agency and central bank publishes on its own cadence, revision policy and vintage convention. Flattening them into one wide table either loses information or fills with nulls, and it gets worse with every country added. Eureka keeps a source-agnostic long-format registry instead, with the layer taxonomy curated as a versioned matrix that a dashboard reconciles against what is actually loaded each day.
That is what makes the roadmap tractable. Adding 25 indicators across six countries was a 32-line YAML change with zero migrations. A new source costs a client class; a new country costs almost nothing.
Limits
- No restore rehearsal. Weekly pg_dump with a three-gate integrity check, including a size floor at 70% of recent good dumps, which is the only gate that would have caught a 186 MB dump whose table of contents looked normal. But WAL archiving is off, PITR is impossible, there is no replica, and the backups sit on the same physical disk as the data. RPO is 7 days on a single-disk single point of failure.
- Point-in-time correctness is self-graded, and one grade is bad. An eight-lens audit scored macro A−, universe B, prices C+, events C, regulatory C−, financials D.
- Contracts exist that nothing consumes. fn_universe_pit, resolve_macro_pit, the continuous-futures library and the financial_available view are implemented and tested with zero production callers. The PIT rail is built and verified; no model rides it yet.
- Collected is not used. 42.1M derivatives rows exist and the feature layer above them is empty. 888,949 macro observations exist and feature engineering reads none of them.
- Analytics is 4,930 lines against 73,268 of pipeline. This is a data-engineering project today. Calling it a research platform would be a lie of proportion.
- Compression and retention are off on all 18 hypertables, consistent with never deleting anything, at the cost of carrying 15 GB of options uncompressed.
Roadmap
Phase 1 Korea, phase 2 the United States and Hong Kong, phase 3 China and Japan, then Europe once those are stable. The US schema scaffold exists at zero rows.
What has to change before a second market is real, all of it measured rather than guessed: the trading calendar holds a single market value with 41 call sites hardcoding it, symbol columns are VARCHAR(6) in 49 tables, and the price table has no currency or exchange dimension.