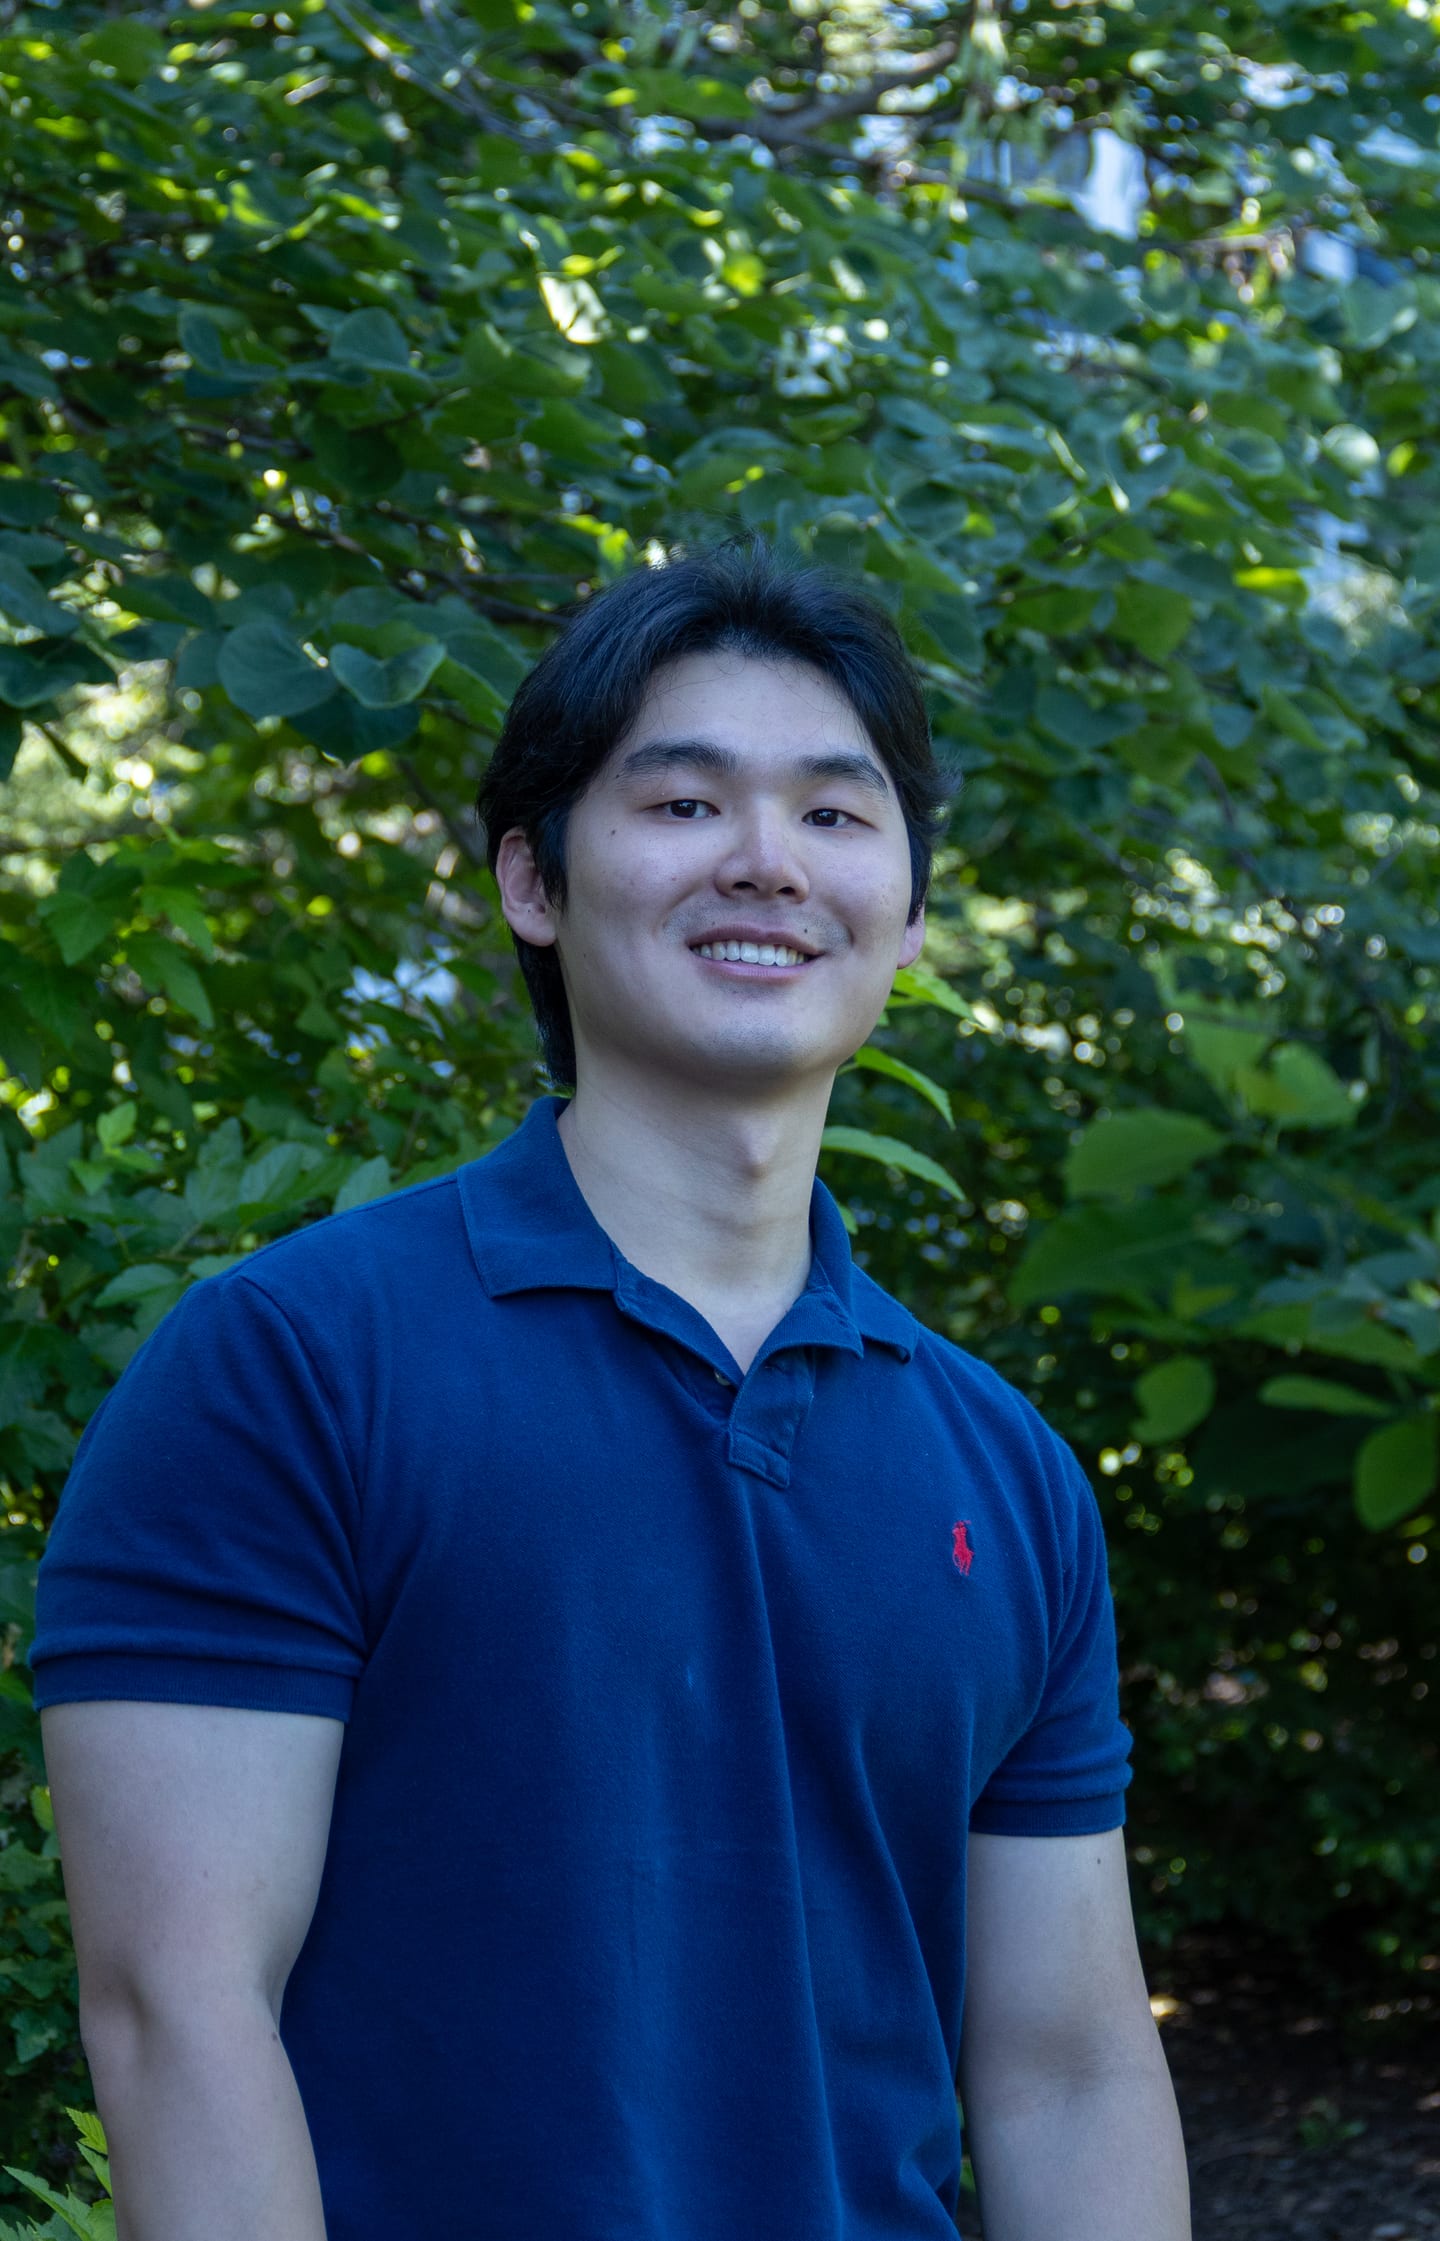
Penn State ’27 · Computational Data Science & Statistics

I build point-in-time market data infrastructure; models for nonstationary, multivariate series; systems that catch themselves being wrong; and the tools I kept wishing already existed.

A market data platform — Korean equities and derivatives at full depth, on a global macro layer, expanding market by market. And a job-search assistant I run myself. Both solo, both still running.

Taemin Kang
The short version

Half the methods I use were invented for something else: earthquakes, missile guidance, machine translation. I keep an eye on where else they might fit, and check whether they transfer before building on them.

Nonstationary and multivariate series, frequency-domain and graph representations, latent-variable and generative models, Bayesian treatments of uncertainty. Markets are where I’ve gone deepest: eight years watching the Korean one, and a point-in-time data platform I built for it.

Now · Sept 2026GNN research on power-grid PMU data with Prof. Yan Li · a poster from this summer’s volatility work · open to 2027 new-grad roles.

Projects

Things that run.
01

Eureka

A quantitative platform in three parts — data pipeline, research and modeling, and automated execution with portfolio optimization. Korean equities, derivatives, bonds and filings at full depth, on a global macro layer spanning seven central banks, sovereign curves, commodities and an event calendar.~150M rowspoint-in-time, back to 200527 scheduled jobs
PostgreSQL · TimescaleDB · systemd Python · PyTorch · statsmodels
02

Artemis

Live ↗
A personalized job-search assistant, built because I was sending hundreds of applications a cycle and tracking none of them. Tracking, networking, tailored résumés and cover letters, interview prep — on top of a posting index parsed by a self-hosted Qwen3.5-9B.307K postingsweb, extension, mobileRLS, DSAR
FastAPI · Next.js · Postgres vLLM · Qwen3.5-9B AWQ
03

Resume Renderer

Open source
The module that turns Artemis’s tailored output into a résumé you can actually submit, split out and released. Templates are CSS only, so they structurally cannot fabricate content, and every theme is checked against real ATS text extraction before it ships.13 themesCSS-only templates10 lint rules from measured failures
TypeScript · MIT

Research

Things that ask a question.
04

Is volatility-regime onset forecastable?

Null result
GARCH and particle-filter stochastic volatility, built from scratch in four specifications and validated by recovering parameters from synthetic data first. A pre-registered experiment then asked whether the fitted distributions could flag a volatility episode before it started. They caught 42% of episodes at p < 0.001. Breaking that down showed the hits sat mid-episode, where a trivial threshold does the same job. Onset detection failed, and the design had the power to say so rather than just miss it.30 years of KOSPI 200pre-registeredpowered null
Penn State SURE Program Mentor: Dr. ByeongJip Kim · PI: Prof. Xiaoyue Niu
05

Power-system stability & oscillation prediction

In progress
Phasor measurement units sample the grid tens of times a second, so a disturbance propagates through hundreds of correlated sensors at once. The grid is not metaphorically a graph, it is one, and the topology is known in advance rather than something a model should have to infer. Three stages: forecast oscillations on a fixed network, then hold up when edges and nodes are removed or switched off, then transfer to a grid the model has never seen.PMU time-seriestopology as priortransductive → inductive
Penn State EMPower Lab Advisor: Prof. Yan Li
06

Spatio-temporal forecasting for equity markets

In progress
Stock returns as a spatio-temporal problem: hundreds of series moving together through relationships that change over time. The work asks where that shared structure lives, across time in frequency bands and across stocks in the eigenvalues of their correlations, and builds what finance already knows about it into the model instead of leaving it to be learned.per-band stock relationsgraph and spectral structuresynthetic → walk-forward → holdout
Independent research
On reposEureka and Artemis are private — happy to walk through the schema and the rail design on a call. Resume Renderer is open source if you’d rather read code first, and Artemis is live but not launched — 28 accounts, all mine or friends testing it.

Eureka, tonight

Figures a nightly job rewrites.
Rows, point-in-time
150.6M
Korean equities, bonds, filings
On disk
86.3 GB
~91 operational tables
Bitemporal tables
16
six revision patterns
Delisted, and kept
29.8%
1,170 of the 3,933 securities in the database
Last measured snapshotMeasured 2026-09-28
Eureka has its own siteThe dashboard these figures come from, live ↗Rails · coverage · sanity · freshness